Motion Design · UX/UI · Graphic Design

Mortgage payments interactive chart

Tools
  • Rive
  • Figma
  • After Effects
  • Photoshop

Overview

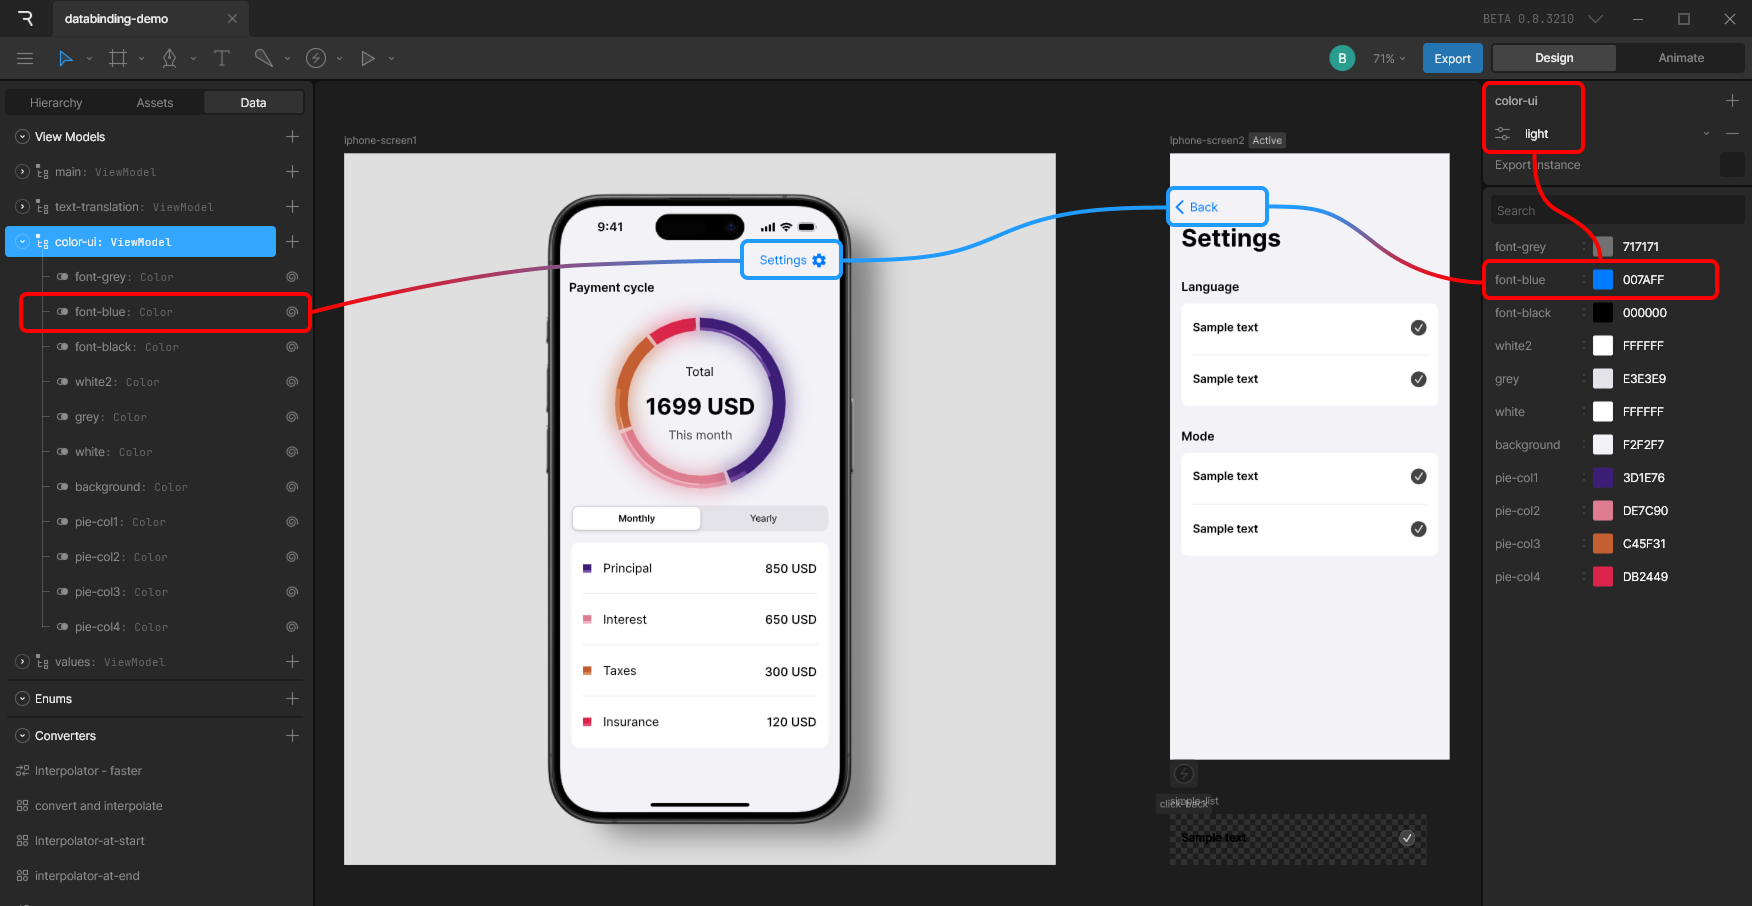
This case study explored the use of Data Binding – a powerful feature that connects design directly with development workflows. The objective was to test its capabilities by integrating a variety of data types: – Numbers for chart values and chart animation – Strings for multilingual text translation – Colors to support both dark and light UI modes

Role

UX/UI Design, Motion Design

Process

The main screen, illustrating a mortgage payment cycle, was initially designed in Figma and then imported into Rive. To reduce repetition, I decided to use nested art boards for recurring UI elements, allowing updates with minimal manual editing. Following the design import, I defined data models and properties for binding. In total, 38 properties were used: 9 numeric, 18 string, and 11 color properties. These bindings enabled dynamic content updates and drove animation logic in the animated pie chart. The final step of the project was to work on the transitions and micro-interactions, enhancing the user experience.

Mortgage experience interface presented with an architectural model
Data binding setup.

More Projects

All projects